
Product · Lens Observability
Every job and notebook run, explained.
Lens shows what happened, why it happened and what to change, in plain words. It shows wasted compute in core-hours and where idle capacity is sitting.
What Lens answers
Four questions, answered for every run.
What happened?
The failure or slowdown in one sentence.
Why?
A causal trace down to the root cause.
What should change?
A recommended fix with impact and risk.
What did it cost?
Wasted compute, in core-hours.
Inside Lens
Six views, one place.
Overview, activity, jobs, infrastructure, causal trace and notebooks in one observability workspace.
OverviewKPI tiles, runs per day, where the time goes and why runs fail.
ActivityEvery run, filterable, with the likely cause and top recommendation beside it.
JobsExecutions by job, average job time and last-run health.
InfrastructureFleet health, capacity and autoscaling, with idle warnings.
Causal traceFrom the failure, layer by layer, to the root cause and the fix.
NotebooksWorkspaces and notebook runs, local or on a remote cluster.
The causal trace
From failure to fix, layer by layer.
Workflow, step, provisioning, driver, executors, Spark stage, failure, root cause and fix, on one page.
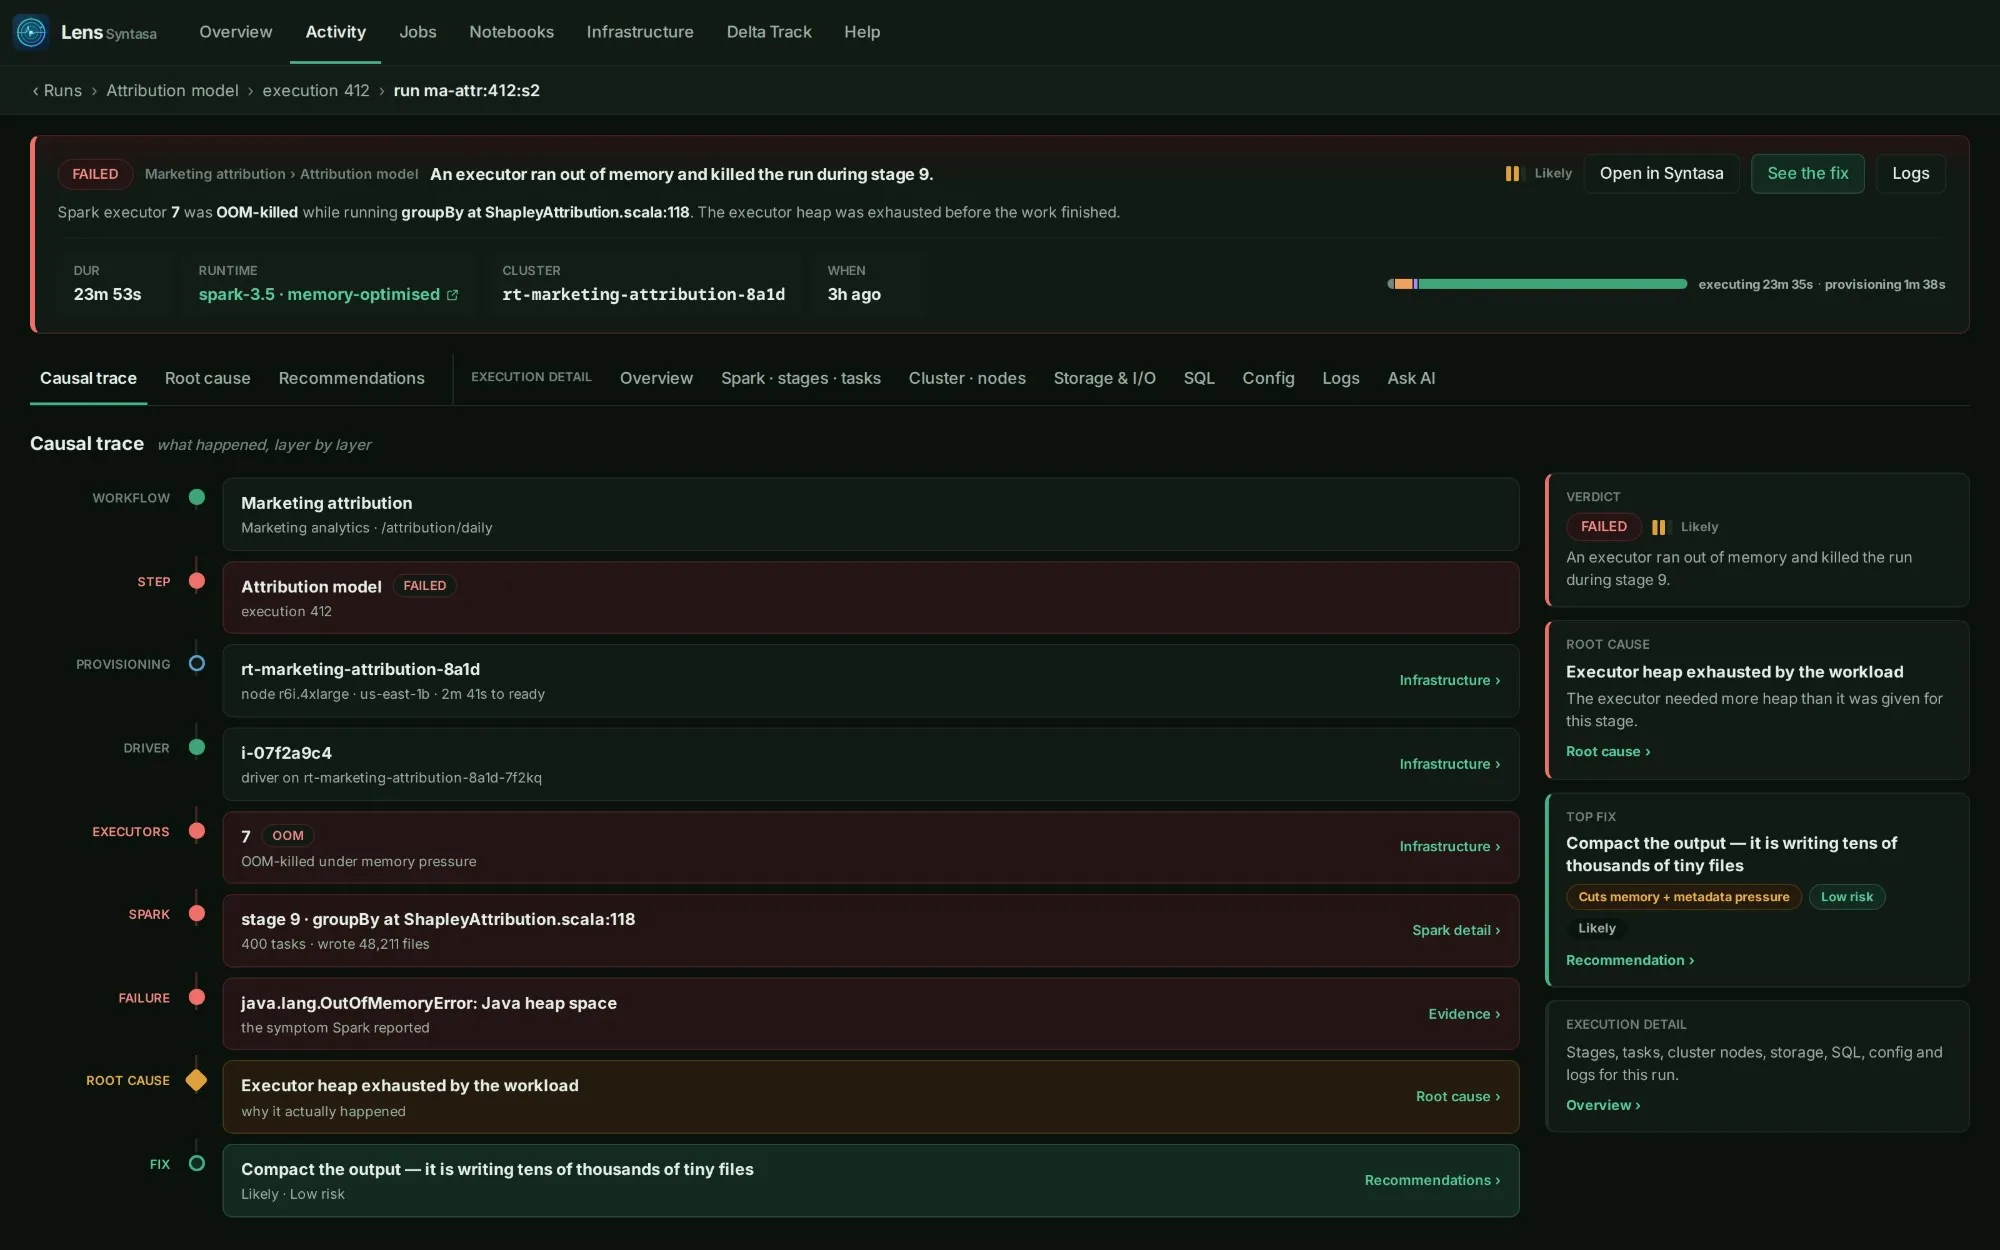
- What happenedThe failure, in one plain sentence, with the run, runtime and cluster beside it.
- Why it happenedA causal trace from the workflow, step and executors down to the real root cause.
- What to changeA recommended fix, with its likely impact and risk.
For every team
One source of truth, for every question.
Overview
Health of the whole platform at a glance, grouped into situations.
Activity
Every run, filterable, with the likely cause beside each failure.
Jobs
Workflow jobs, stages and tasks over time.
Notebooks
Notebook runs, kernels and their Spark work.
Infrastructure
Fleet, clusters and nodes, with idle warnings.
Delta Track
Table health, trends and small-file counts.
Overview
The whole platform, in one read.
Runs, success rate, failures, durations, compute and wasted compute, plus where the time goes and why runs fail. Every figure updates in place as runs report.
- Situations group related runs and explain the likely cause
- Wasted compute shown in core-hours
- Time saved (modeled) and files compacted by table care
Infrastructure
Find idle capacity before the bill does.
Fleet health, capacity and autoscaling across EMR, Dataproc and Kubernetes, with warnings for idle nodes and idle runtimes.
- Capacity by pool and runtime
- Scaling activity as it happens
- Recommendations when the fleet needs attention
Execution logs
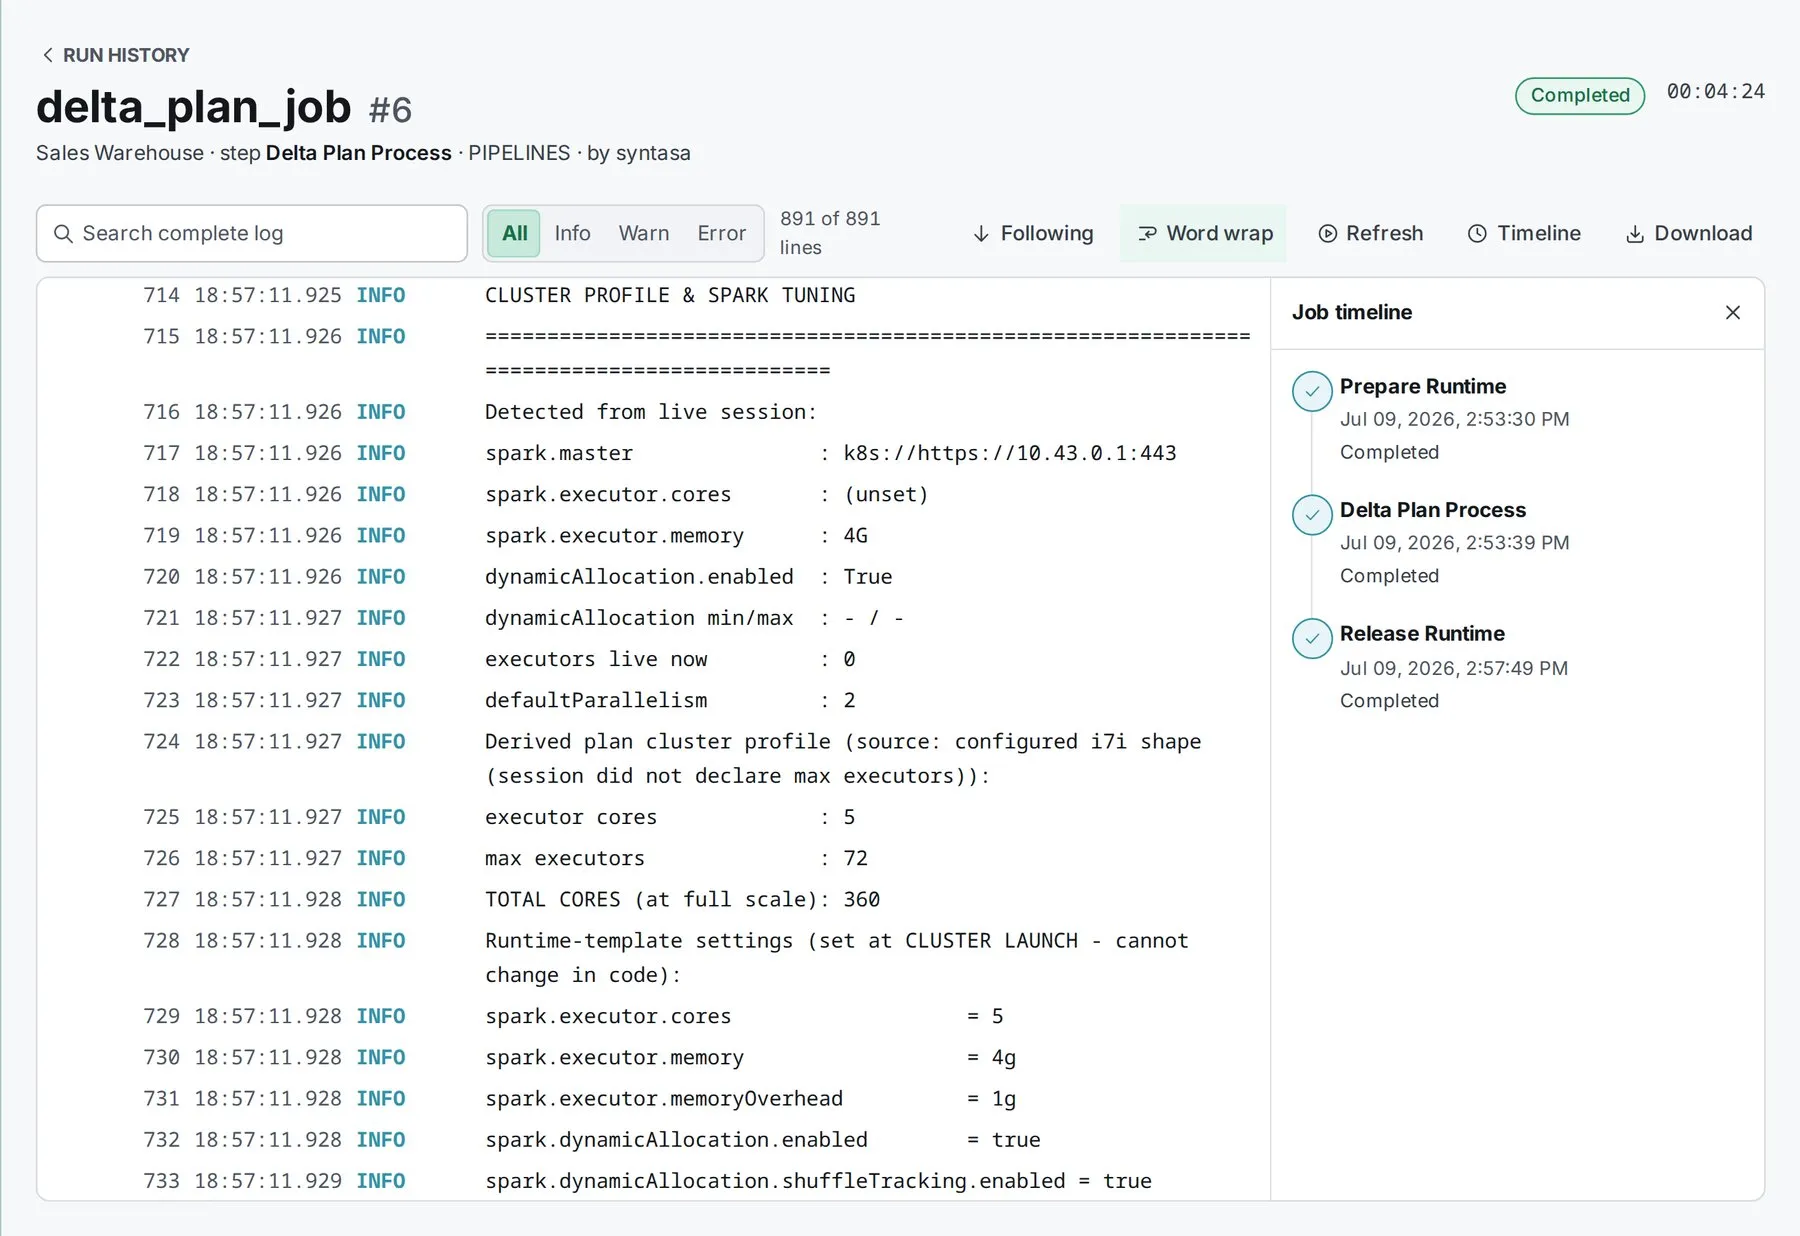
Search the logs without hunting for them.
Spark and notebook logs in one searchable place, shared according to the same permissions as the work itself.
Who it helps
Calmer on-call. Clearer decisions.
Data engineers
Root cause and fix instead of log archaeology.
Data scientists
Know why a notebook job slowed down.
Platform owners
Idle capacity, scaling and fleet health.
Leaders
Success rate, durations and waste over time.
See Lens on your runs.
We will connect Lens to a few of your workloads and walk through the trace for something that failed or ran slowly.