
Civilian Government · Public Health
Know your community's health needs in weeks, not years.
Syntasa's AI-powered CHNA solution turns public health records, search trends, and census data into a data-driven Community Health Needs Assessment, without replacing the community engagement your assessment still requires.
The problem
A federally required assessment that is out of date before it is published.
Public health departments, nonprofit hospitals, and Federally Qualified Health Centers must complete a Community Health Needs Assessment every three years. The traditional process (focus groups, resident surveys, manual data pulls across siloed public and private sources) is largely manual and time-consuming, and can take up to a year to complete.
By the time survey data is analyzed and the report is published, it can be nearly a year out of date. The health concerns a community is actually living with (a rise in overdoses, a spike in anxiety searches, a new cluster of respiratory illness) don't wait for the next assessment cycle to surface.
The traditional cycle
- up to 12 months
Surveys, focus groups, manual data pulls
- 18 months
Dearborn's first citywide assessment
- 3 years
Report then sits static until the next cycle
What it does
Four shifts in how an assessment gets built.
The aim isn't to replace the community process with AI. Agencies need both the depth only direct community engagement provides, and the speed and breadth only continuous, automated analysis provides.
Cut the assessment cycle from up to a year down to weeks
Traditional
up to 12 monthsCHNA 2.0
weeksComprehensive data integration
Collects and cleans data from 70+ public and private sources (electronic health records, census data, Wayne State University's Project PHOENIX data warehouse) into consolidated pipelines ready for analysis with Vertex AI, replacing manual, siloed data pulls.
AI-assisted report generation
A human defines the report's structure; Gemini extracts insights from the relevant datasets and fills in the detail, turning a task that traditionally takes up to a year into one delivered in a matter of weeks.
Surface what the community is already telling you
Rising in the Dearborn pilot
Syntasa Sentiment Analytics
Combines official survey data with real-time signal from Google Search and social media to surface what residents are asking about and posting. In the Dearborn pilot this included rising searches for terms like "anxiety" and "stroke," and growing discussion of asthma and clinic wait times.
Social listening
Analyzes public social media discussion to surface emerging topics. The Dearborn pilot found "Safety and Violence" as the most-discussed community topic, a concern not among the community's four final CHNA priorities but a real signal worth tracking.
AI that augments your community process, not replaces it
Human-in-the-loop by design
The person managing the CHNA defines the report's structure; Gemini fills in the analysis. Public health experts review AI-drafted findings and summaries for accuracy before anything is finalized.
A living document, not a static report
Because the underlying data pipeline runs continuously, the assessment can be kept current with fresh data rather than published once and left to age for three years.
Sentinel surveillance, not a snapshot
Dr. Phillip Levy (Wayne State, creator of Project PHOENIX) frames this as a tsunami warning system: a network of buoys sending back a constant signal, rather than a report written after the wave hits.
Built to work alongside your survey and focus-group process
In the Dearborn comparison, the AI-driven approach independently confirmed 3 of Dearborn's 4 final community-voted priorities using public data alone, but correctly did not claim to have found Child Health or Health Literacy, priorities that only emerged from direct resident surveys and focus groups.
| Priority | AI data | Community survey |
|---|---|---|
| Mental & Behavioral Health | Confirmed | Confirmed |
| Environmental Health | Confirmed | Confirmed |
| Social Determinants of Health | Confirmed | Confirmed |
| Child Health | Not found | Confirmed |
| Health Literacy | Not found | Confirmed |
Turn findings into targeted action
Neighborhood-level disparity mapping
Ranks neighborhoods against each other across dozens of health and socioeconomic metrics (poverty, unemployment, insurance coverage, chronic disease rates), so interventions can be targeted rather than citywide.
Interactive dashboards
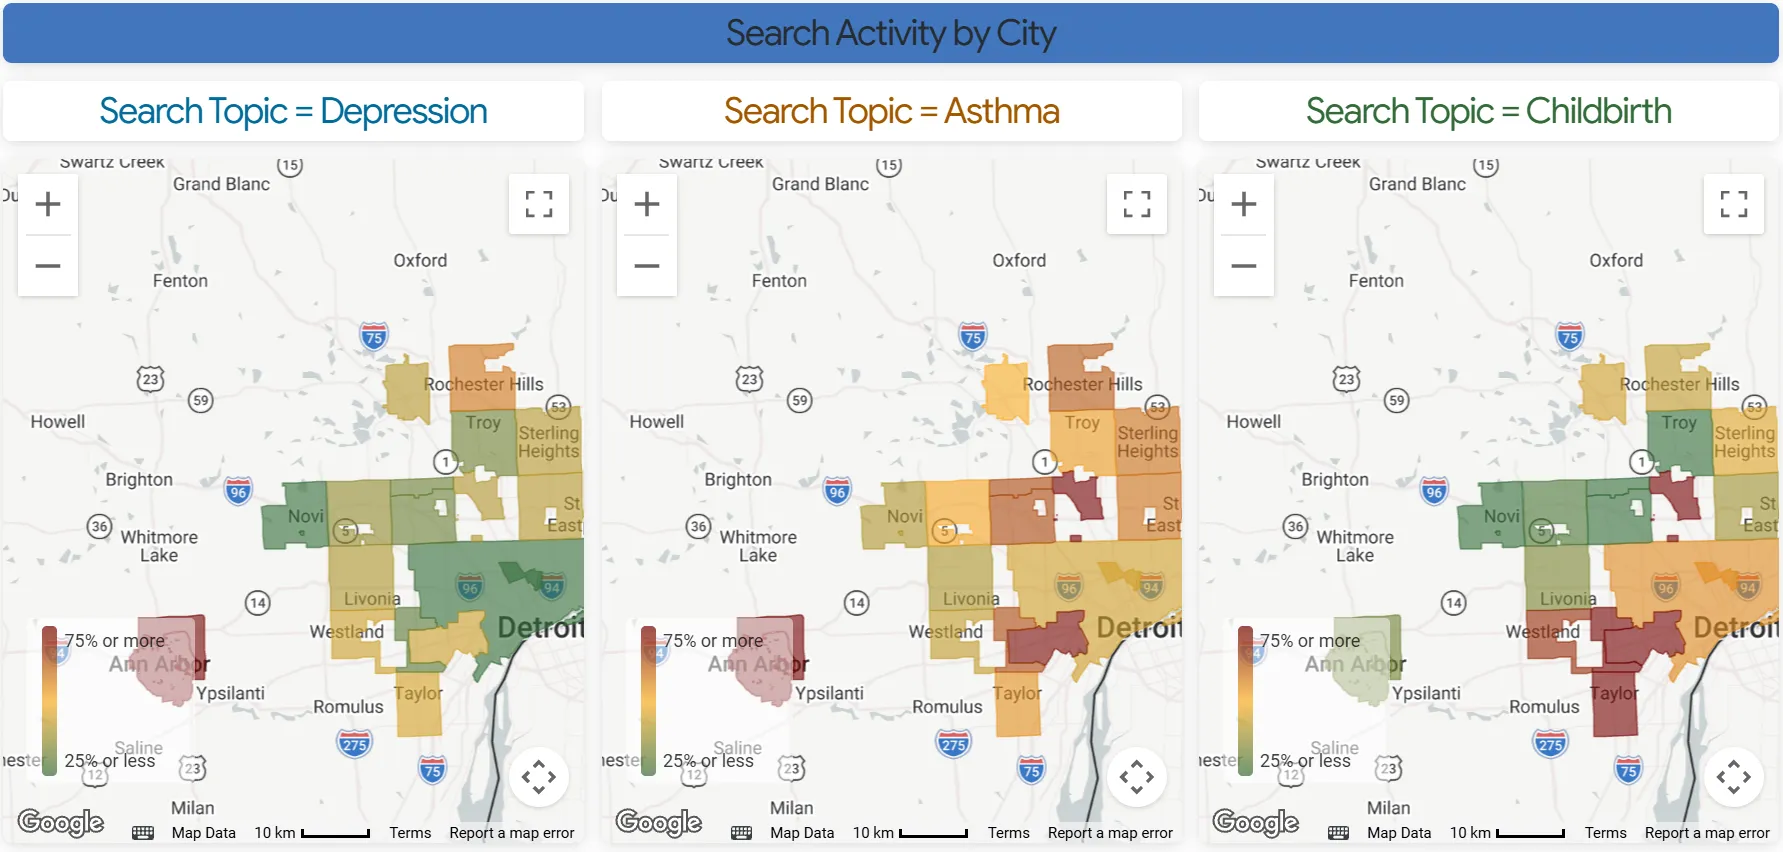
Findings presented through interactive geographic and topic visualizations, for exploration by neighborhood and search interest, instead of a static PDF report.
Highest-need neighborhoods in Dearborn
The platform underneath
One pipeline, from public health data to a report.
Four modules of Syntasa's Data + Agentic AI Platform, framed for public health.
Step 1: Data Ready
Ingests and cleans public and private health data (EHR data, census, Wayne State's PHOENIX warehouse, search and social trends) into one governed pipeline built on Google Kubernetes Engine, Cloud SQL, and Cloud Storage.
Step 2: AI Models
Vertex AI and Gemini power trend analysis, topic modeling, categorization, and generative drafting of report narrative and summaries; BigQuery handles the sentiment-analysis workload at scale.
Step 3: Agents
Orchestrates the multi-step CHNA workflow: pulling from the right datasets per the human-defined report structure, drafting each section, and routing output to public health experts for review before anything is finalized.
Step 4: Decisions & Actions
Turns findings into interactive dashboards and neighborhood-level targeting so public health teams can act on results, not just read them.
Proof
Proven first in Dearborn, Michigan.
City of Dearborn · Wayne State University · Google Public Sector
Dearborn was the first city to deploy CHNA 2.0, with great success.
Built with Wayne State University's Project PHOENIX and Google Public Sector, with plans to bring the same capability to other cities and counties in Michigan and across the nation.
“Google's AI gives this solution its horsepower: Vertex AI and Gemini can make sense of dozens of data sources at once. What turns that horsepower into a CHNA a health department can trust is Syntasa's Data + Agentic AI platform, and the know-how to stand it up for public health agencies. That's how you get from a manual process that used to take a year to an automated one that takes weeks.”
Deployment & trust
Your data and models stay in your boundary.
- Deploys into your agency's own private Google Cloud account.
- No data is shared with Syntasa or Google; everything stays inside your environment.
- No certifications are listed for this solution: the Dearborn project did not involve PHI.
Built on Google Cloud
Ecosystem
Built with the people who know public health.
Wayne State University
Developed Project PHOENIX (Population Health OutcomEs aNd iNformation eXchange), the data warehouse of 70+ anonymized sources this solution builds on. Led by Dr. Phillip Levy, M.D., M.P.H.
Google Public Sector / Google Cloud
Delivery partner. Vertex AI, Gemini, GKE, Cloud SQL, Cloud Storage, and BigQuery form the technical foundation.
Google Looker
Interactive dashboard layer for presenting findings by neighborhood and topic.
Resources
Go deeper on CHNA 2.0.
- Session recording
Watch Dr. Levy explain it
Google Cloud Next 25 session on sentinel surveillance and Project PHOENIX.Watch - Google Cloud blog
Transforming public health assessments with AI
How Wayne State University, Google Public Sector, and Syntasa built CHNA 2.0.Read - Community context
Dearborn's own CHNA announcement
The city's results release: the community process behind the assessment, not the AI solution itself.Read
FAQ
Questions public health teams ask first.
No. The AI analysis is designed to run alongside your existing community engagement, not instead of it. In Dearborn, the AI-driven approach independently confirmed several community-voted priorities using public data, but priorities that only surface through direct resident input, like health literacy, still need that input.
Public health records, census data, Google Search trends, and, where available, social media discussion, consolidated into a single pipeline for analysis with Vertex AI.
A traditional CHNA can take up to a year to complete manually. Syntasa's CHNA 2.0 solution, built with Wayne State University and Google Public Sector, delivers a complete assessment in a matter of weeks.
Public health experts review AI-drafted summaries and reports for accuracy before anything is published. The AI drafts, people verify.
None of your data is shared with either Syntasa or Google. It all stays within your agency's own private Google Cloud account.
Request a briefing on your next assessment cycle.
Tell us when your CHNA is due and what data you already hold. We'll walk through what CHNA 2.0 would look like in your own cloud environment, alongside the community process you already run.