
Public sector · Sentiment Analytics
Hear every community, not only those who respond.
Behavioral Sentiment Analytics taps the digital behavior your community already creates (search, social media, news, surveys, calls and chat) to show needs, attitudes and narratives by neighborhood, with results in weeks.
The gap
Surveys alone leave you guessing.
Leaders are asked to understand how residents feel about health, transportation, safety and trust, urgently and in detail. The usual tools each leave a hole.
Opinion polls
Polls of the broader community and its segments are conducted at a point in time, and attitudes change. Responders may not be representative of the general public (selection bias).
You're not hearing from everyone.
Satisfaction surveys
Surveys of website visitors and customers are limited to people who are visiting your site, and responses may not reflect true beliefs, because of social pressure (response bias).
They're not telling you their true feelings.
Reputation and social listening
News articles and social media mentions give a snapshot, and requiring continuous studies to track change is expensive. A typical survey gathers around 2,000 responses: enough for an overview, not for neighborhood detail.
They can't show how attitudes are changing.
Community meetings have the same trouble: they hear from the same ten people every time.
How it works
Digital behavior, turned into direction.
Every day your constituents visit your websites, search, post, call and answer surveys. Each of those is digital behavior, and together they are a rich, passive stream of data.
Step 1: Broaden the view
Bring diverse sources of digital behavior together: social media, news, search, surveys, call centers, chatbots, websites, ads, census and social risk.
Step 2: Apply AI
Continually refresh the data and apply NLP algorithms, topic models and geo-opportunity models to show trends and where to act.
Step 3: Take action
Sentiment informs communications, community relations and situation analysis, and builds audiences for campaigns.
Sources it brings together
What you see
Narratives, themes and trends.
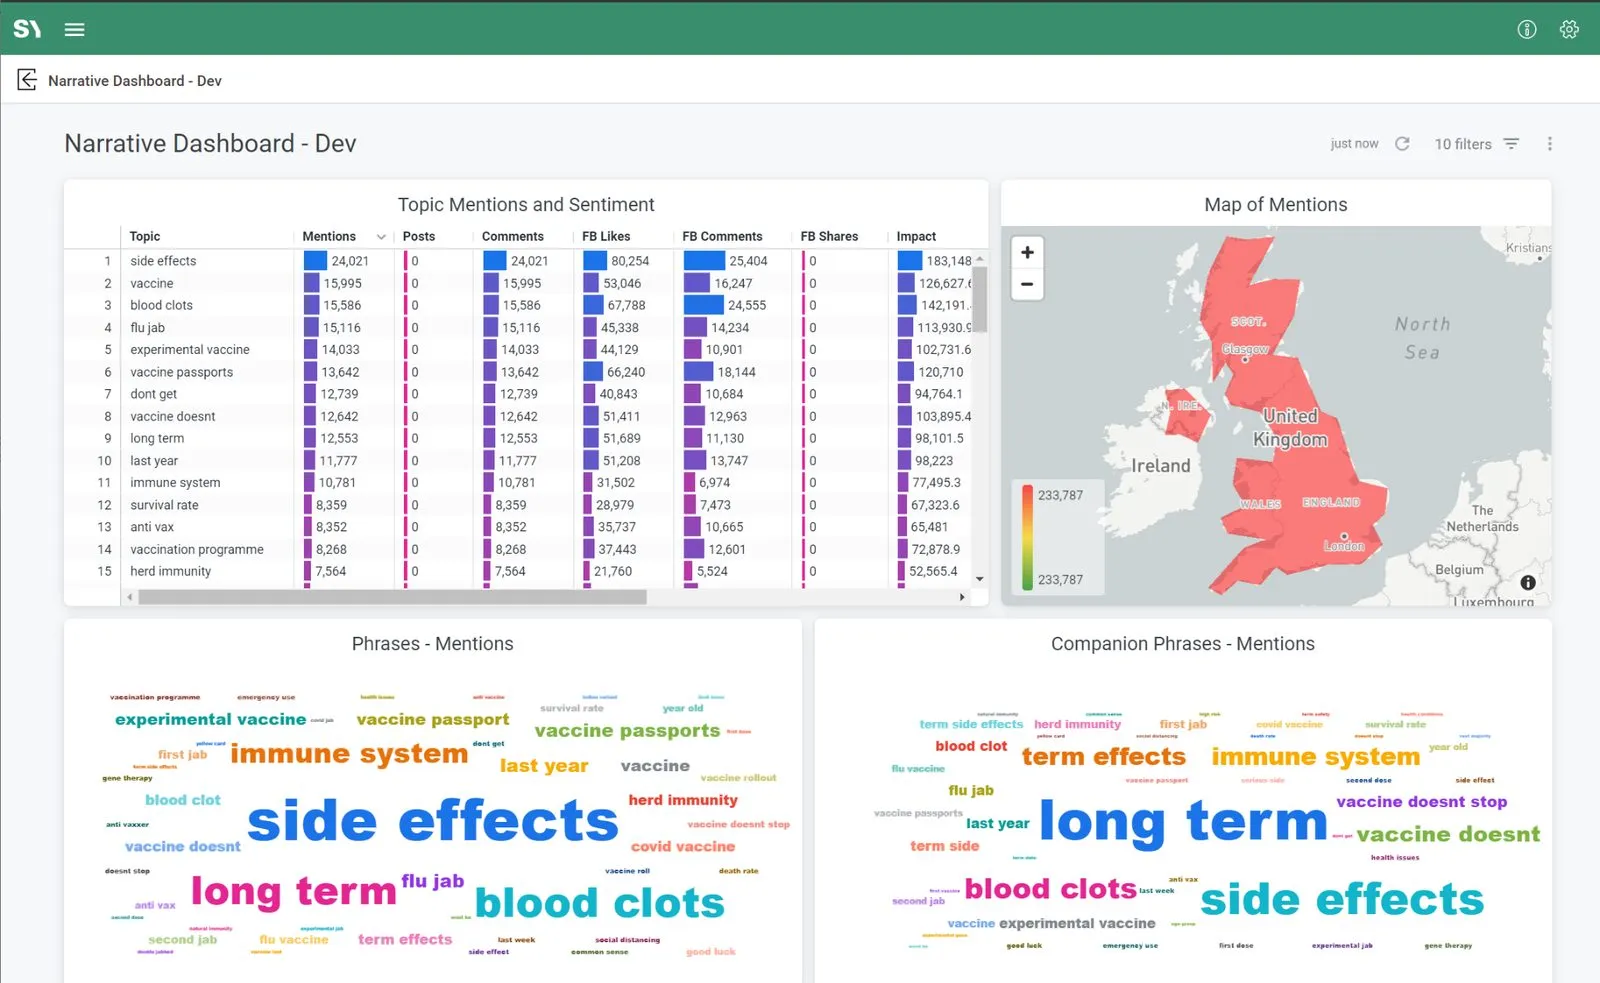
Insights arrive as dashboards and visualizations that can be customized to your project. Three are typically included.
How a subject area is modeled
- Subject areas: the keywords and query logic that isolate conversations about a topic such as climate, tourism or vaccination.
- Themes: top-down topics your experts define, refined by the topic modeling.
- Topics and phrases: bottom-up topics and the phrases, and companion phrases, that emerge from the data, with phrase hints so you stay in control.
- Modeling window: thirty days for a long-term goal, one day for a short event.
- Languages: English by default, with other languages supported.
Overview
Metrics, trends and the geographic spread of online conversation for a subject area, an easy summary for leadership.
Narrative
Themes, topics, phrases and trends in depth, for analysts who want the nuance, down to the original text.
Outcome
Attitudes and narratives alongside the outcome metrics you care about, such as vaccination progress.
The AI
Language models that do the reading.
Pre-built analytics apply Google Cloud and open-source NLP to the combined data, then aggregate it by geography, age group, gender and ethnic group, with per-capita adjustments from census data.
Sentiment
Google Cloud Natural Language scores the prevailing opinion from -1 (most negative) to 1 (most positive), with a magnitude for the scale of the feeling.
Toxicity
The Perspective API, from Jigsaw and Google, scores rude, disrespectful or unreasonable text from 0 to 1.
Entities
Names of people, places, organizations and events, with a salience score for how central each is to the text.
Topic modeling
Finds the most prevalent topics, assigns them to new text and spots emerging ones, using Vertex AI and Gemini where a project calls for it.
From insight to action
Put what you learn to work.
Messaging
Narratives show what people are saying and where official messaging lands or doesn't, so outreach by officials and trusted messengers can respond.
Precision targeting
Geo-opportunity models estimate scores at ZIP code level where source data is thin, with a measurable confidence for each model.
Audiences
With access to your advertising accounts, focused audiences are created and refreshed automatically as the data changes, which improves campaign cost-effectiveness.
Equity
Demographic and social vulnerability data, with per-capita adjustments, show how more vulnerable communities engage compared with the whole.
Proof
Proven with public sector leaders.
- UK Cabinet Office6 weeksto an MVP for the UK's G7 presidency, later across 110 countries
- California300%more engagement from sentiment-driven audiences for the CalFresh program
- Federal regulatory agency98%of duplicate public comments removed from review
- Palm Beach County1,400+free-form responses analyzed, with 85%+ classification accuracy
“Our vision is to build the digital infrastructure, with the World Health Organisation, to enable the collaboration of international, national and local partners, including in vulnerable countries to promote vaccine confidence.”
“What used to take weeks now happens in hours, with insights we can actually act on. The ability to see sentiment patterns across demographics and regions transformed how we approach equity in transportation planning.”
UK Cabinet Office: the MVP, now continued by the World Health Organization, defined cohorts of the undecided, acceptors and rejectors of vaccines. Palm Beach County: 30 survey questions, 10 transportation themes, 70 to 80% less manual effort and seven strategic recommendations.
Beyond one subject
Built to move between topics.
A subject area is a set of keywords and logic, so the same pipeline and dashboards apply wherever you need to understand attitudes.
Deployment & trust
Inside your Google Cloud account.
Sentiment data can be sensitive, so the software goes to your data, not the other way round.
- Runs natively inside your private Google Cloud account, keeping sensitive data inside your firewall.
- Personally identifiable information is anonymized at ingestion, by encryption.
- Built on Syntasa's Data + AI Platform, with everything in BigQuery for your own analytics.
Built with Google Cloud
Resources
Hear it from the people who used it.
- Keynote segment
UK Cabinet Office on building vaccine confidence
Gerald Mullally on the global vaccine confidence platform, from Google Cloud's Government & Education Summit keynote.Watch - Mention
Data Con LA 2021: Scaling Sentiment to Geotarget Vaccine Distribution
Syntasa's CTO & Co-Founder and California ODI on estimating vaccine hesitancy at the zip-code level.Read - Mention
Reevaluating Vaccine Sentiment: An Episode of the AI: Gov Reimagined Podcast
How California used sentiment analytics, built with Syntasa, to understand vaccine hesitancy and redirect resources.Read
FAQ
Questions leaders ask first.
No. Surveys are one of the sources: if you already run on-site or community surveys, the responses are ingested automatically, and Syntasa can help design and run them if you don't. Sentiment analytics adds the sources surveys can't reach, and the continuous view they can't give.
Social media, news, search, community and on-site surveys, call center transcripts, chatbot conversations, websites and apps, advertising, census and social risk data, brought together in one pipeline that stays up to date.
A typical engagement delivers a sentiment dashboard and a narrative dashboard in about twelve weeks: integrations first, then modeling, then deliverables. The UK Cabinet Office MVP took six weeks.
English is the default and additional languages can be supported for a subject area.
The software runs natively in your private Google Cloud account, and personally identifiable information is anonymized by encryption at ingestion.
The same platform can keep refreshing the insights, and Syntasa also offers ongoing analytics and insights services in short sprints as topics change. A working session is the fastest way to scope yours.
Find out what your community is telling you.
Bring a subject area and the decision it should inform. We will show how the digital behavior you already have could answer it.